


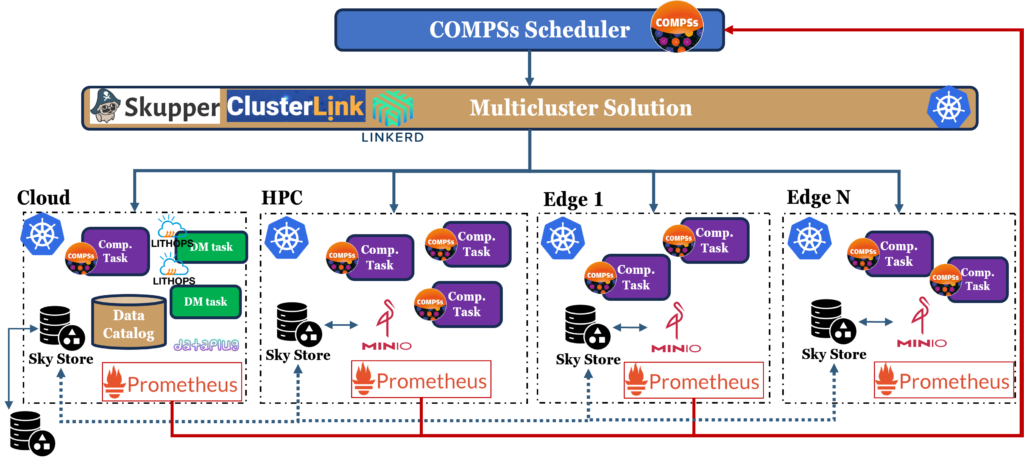
One of the main goals of the EXTRACT project is building an integrated platform that allows complex data workflows to be run smoothly across a very diverse set of environments: from powerful HPC systems to more resource-limited edge devices, with the cloud sitting in between. It’s a challenging setup, where different components for compute, orchestration, monitoring, and storage all need to work together reliably, something which is not a given due to the system’s heterogeneity. In this post we summarize the relationship between the selected components and how it works to optimize performance, latency, and resource usage dynamically, depending on the nature of the workload.
Orchestration with Kubernetes
For the platform to work, we need a strong foundation for deploying and managing containers across all sites. While more lightweight alternatives to Kubernetes exist, such as K3s, MicroK8s, KubeFed, and KubeEdge, we opted for upstream Kubernetes (“vanilla”) due to its broader community support, better integration with external tooling, and greater flexibility. The decision was also driven by the need for features often absent in other distributions, such as full-featured service discovery, network policy enforcement, and multi-cluster support.
This uniform orchestration layer allows the rest of the EXTRACT software stack to remain portable and consistent across very different hardware, whether it’s a Jetson board at the edge or a cloud VM. This foundation has also made it easier to integrate the rest of the EXTRACT stack, from monitoring to storage and orchestration.
Storage Layer
Since many workflows in the EXTRACT platform involve unstructured data, for example, images, telemetry, or signal recordings, we adopt object storage as the primary data abstraction layer. For this reason, we use object storage as our primary backend. MinIO is our go-to solution in most deployments because it’s lightweight, S3-compatible, and easy to manage on Kubernetes. In some cloud environments, we take advantage of native S3 services when it makes sense, as is the case with OVH, the cloud provider we are using.
To reduce latency in cross-site data accesses without unnecessary data replication, we deploy a SkyStore component at each site (see Demo page for more on the SkyStore configuration explained). SkyStore performs intelligent object caching, predicting access patterns and transparently caching remote objects locally. This significantly reduces response times and network pressure in workflows with heavy I/O demands or latency-sensitive operations.
Monitoring and Observability
Observability is essential for maintaining responsiveness and optimizing the orchestration logic. For this purpose, we integrate a Prometheus-based monitoring stack. Prometheus scrapes metrics from both infrastructure (CPU, memory, network usage, etc.) and application-specific exporters. These include standard exporters as well as domain-specific ones such as custom Jetson exporters for monitoring NVIDIA edge devices, or Pushgateway for capturing transient metrics like task execution time.
Monitoring data is stored locally but can also be aggregated or queried remotely, enabling the orchestrator to make globally-informed decisions. Grafana dashboards are used to visualize this data in real-time, assisting both developers and users in performance analysis and debugging.
Metadata Management
On the data management front, EXTRACT uses a centralized Data Catalog service hosted in the cloud. This component is key in versioning datasets and models, attaching metadata (e.g., origin, versioning, ownership…), and managing lifecycle operations. The Data Catalog can also serve as a trigger mechanism via MQTT or REST APIs. For instance, to notify downstream systems when a new machine learning model has been registered or a dataset has been updated.
This supports automation and interoperability across use cases. In the TASKA use case, for instance, the training of a new neural network model for antenna data analysis can automatically trigger evaluation steps or post-processing tasks.
Multi-Cluster Networking
As the compute continuum naturally spans different geographical sites and administrative domains, a multi-cluster communication layer is essential. In EXTRACT, we are currently benchmarking different technologies for this role. Namely: Linkerd, Skupper, and ClusterLink.
Each of these solutions address the challenge of connecting Kubernetes services across distributed clusters in a secure and scalable way. They enable the COMPSs scheduler to spawn and communicate with workers across sites, exposing remote services locally and ensuring that orchestration decisions are not limited to a single physical location.
By enabling transparent inter-cluster service discovery and communication, these technologies allow EXTRACT to shift workloads dynamically across the compute continuum. For example, offloading compute-heavy tasks from a saturated edge node to an idle HPC cluster, without modifying the application logic.
Workflow Orchestration
At the top of the stack, COMPSs acts as the orchestration brain of the platform. It schedules tasks across the continuum by taking into account data locality, resource availability, and real-time performance metrics gathered from Prometheus. COMPSs decomposes complex applications into distributed task graphs, dynamically spawning workers and deciding their optimal placement.
When tasks involve massive data operations, such as transformations or batch preprocessing, Lithops complements COMPSs by partitioning the data and executing parallel jobs in a serverless-like fashion. Importantly, COMPSs treats Lithops applications like any other task: it remains agnostic to their internal parallelism, allowing for nested scheduling that enhances both computing and data parallelism transparently.