


The city of Venice is showcasing how the EXTRACT project’s Personalized Evacuation Route (PER) use case is testing EXTRACT’s cutting-edge extreme data mining technologies across the compute continuum. Venice was selected for its unique challenges—particularly in crisis management and emergency evacuations—making it an ideal testbed for data-driven innovation.
The PER use case demonstrates the potential of EXTRACT technology to transform vast streams of heterogeneous data into actionable knowledge that can tackle key societal challenges. Venice’s distinctive urban and environmental landscape calls for a customized approach to emergency management, and EXTRACT is answering that call through a pioneering use of data and AI-driven decision-making.
The EXTRACT workflow integrates several advanced components:
• Urban Digital Twin (UDT): Serving as the digital backbone, the UDT fuses data from Internet of Things (IoT) sensors, satellite imagery, and 5G signals into a dynamic, real-time model of the city. The 3D model of the UDT is now nearing completion, bringing a highly detailed and spatially accurate digital representation of Venice closer to reality.
• Reinforcement Learning (RL): A sophisticated AI system trained to optimize evacuation paths, continuously adapting based on incoming data to maximize safety and efficiency.
• Simulation Environment: A controlled space for safely testing learning strategies in scenarios that cannot be easily reproduced in real life—such as explosions or large-scale fires.
By combining real-time data on individuals’ exact locations, environmental conditions, and pedestrian density, EXTRACT contributes to improving public safety through more intelligent and effective evacuation strategies.
Progress Update: Mobile Interface and 3D UDT Near Completion
Mobile interface
Beyond the technical implementation of the platform’s backend components, the project team has been working on developing a mobile interface that will serve as a crucial tool for real-time emergency response. This mobile application is designed to deliver personalized evacuation guidance directly to users’ smartphones, ensuring that individuals can make informed decisions during crises.
A key focus of the development process has been creating an intuitive and user-friendly interface. Recognizing that emergency situations demand quick action and minimal cognitive load, the design prioritizes simplicity and clarity. With a streamlined layout, clear navigation, and easily accessible alerts, the app ensures that users—whether residents or tourists—can quickly locate and understand the directions they need to follow.
The mobile interface is also highly responsive, dynamically adapting to changing conditions. It integrates real-time data from the EXTRACT platform, collected from various sources, including danger and safe points, optimal routes, and the simplest actions to take. This ensures that the guidance provided is not only timely but also tailored to an individual’s specific location and circumstances. For example, during an evacuation scenario, the app can provide step-by-step directions to the nearest safe zone while avoiding congested or hazardous areas.
Additionally, the application supports multilingual functionality to accommodate diverse populations, making it accessible to both locals and international visitors.
By combining advanced backend capabilities with an effective mobile interface, the project aims to bridge the gap between raw data collection and actionable insights. Ultimately, this platform empowers individuals to respond swiftly and safely in emergency situations, reinforcing public safety and resilience in disaster-prone areas.

3D Urban Digital Twin of Venice
Simultaneously, the 3D model of Venice’s Urban Digital Twin is nearing completion. This visual and spatial representation will allow emergency planners, public authorities, and AI systems to interact with city data in more immersive and precise ways, strengthening both real-time response and long-term preparedness.

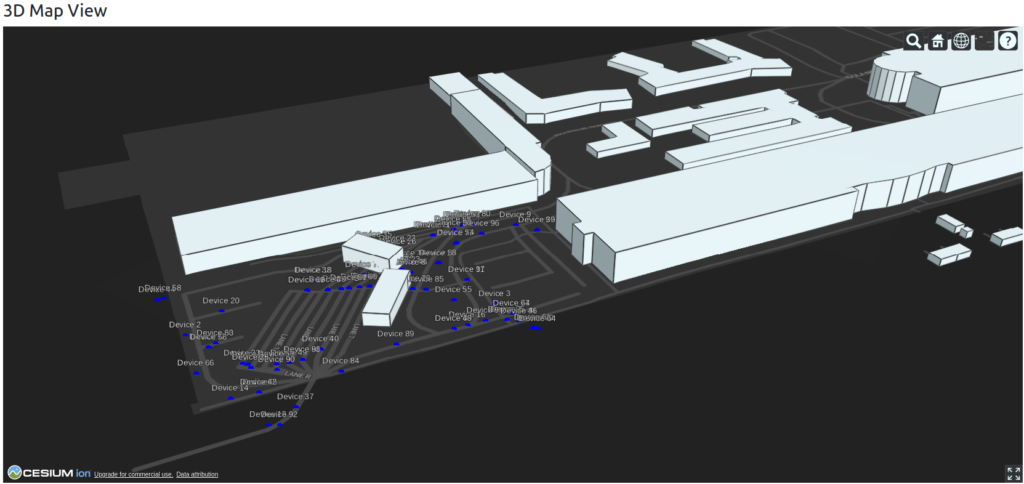
Figure 1 – General Dashboard View:
This figure shows the main interface of the urban digital twin dashboard. It includes navigation panels, system status indicators, and quick access to the different visualization and control features such as 2D/3D maps, real-time data layers, and event generation.
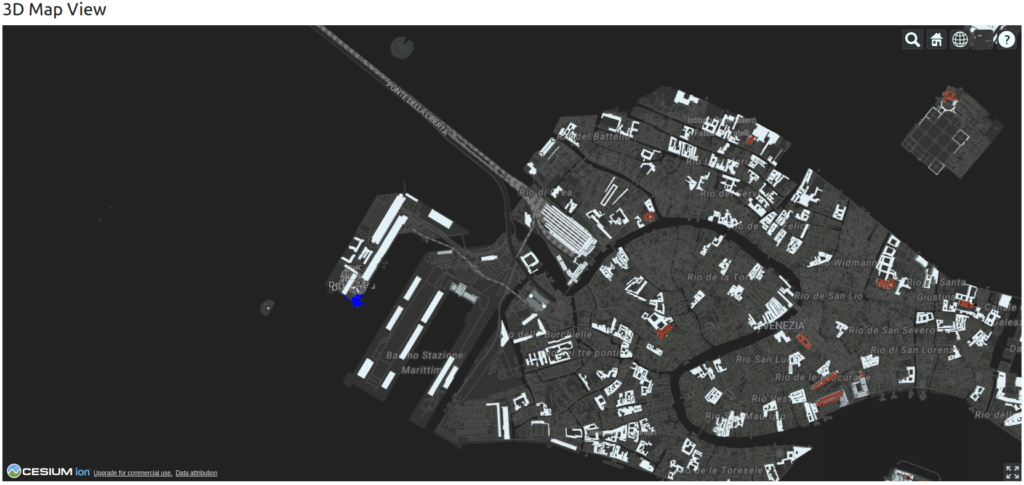
Figure 2 – 3D View of Tronchetto Area (Zoomed):
A detailed 3D visualization of the Tronchetto area in Venice. Buildings are rendered in three dimensions, and real-time mobile device positions are displayed as moving data points. The view is zoomed in to highlight the activity and spatial layout of this specific zone.
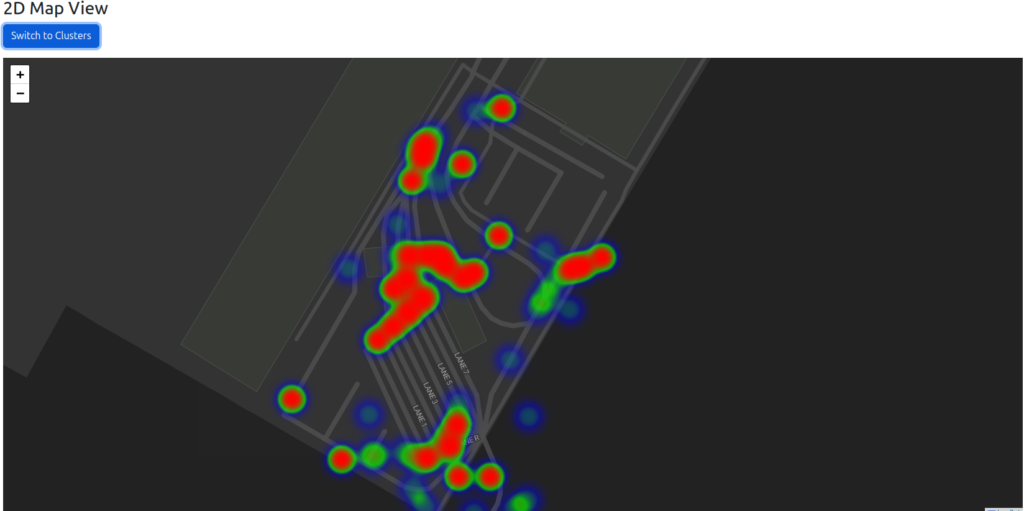
Figure 4 – 2D Map Heatmap View:
This figure shows a 2D map representation with a heatmap overlay. The heatmap indicates the density of mobile devices across the city, with color gradients reflecting areas of high and low concentration. It provides an intuitive view of population flow and hotspots.
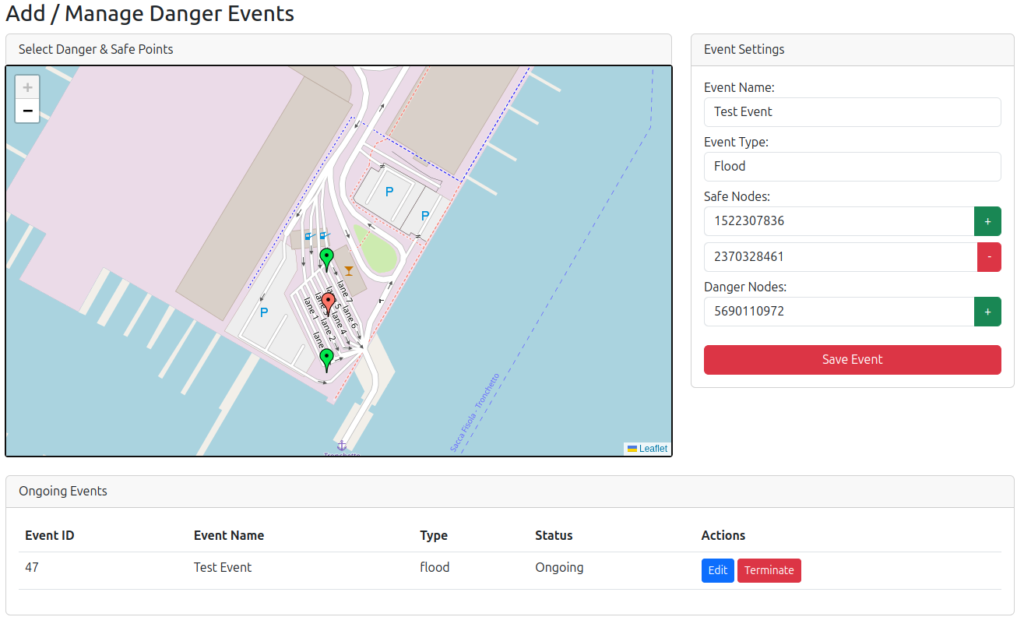
Figure 5 – Generating an Event from the Map:
An example of the interactive map interface used to create a danger event. The user selects danger zones and safe points directly on the map, defines the area of influence, and assigns attributes like event type and capacity. The event is then published to the system in real time.