


The EXTRACT project is an innovative project with two different use cases with the same challenge of integrating data for actionable knowledge. Despite their differences, both of the use cases, the Personalized Evacuation Route and the Transient Astrophysics with a Square Kilometre Array Pathfinder (TASKA) rely on distributed nodes within the Edge to Cloud Continuum. Ensuring the EXTRACT platform functions properly requires knowing the status of these nodes, a task addressed by the monitoring platform developed by Ikerlan.
The EXTRACT platform comprises a wide range of heterogeneous nodes, from powerful Cloud-based nodes, in which complex AI models can be trained and where enormous amounts of data can be stored, to resource-constrained devices, smaller than our day-to-day smartphones.
The two main goals of EXTRACT’s monitoring platform are to:
- Ensure that all these nodes are working according to the specified functional and non-functional requirements, and
- To keep track of the availability of the computing and storing resources they provide.
To reach these goals, it is crucial to identify the most relevant metrics to be collected, such as nodes´ available CPU and memory usage. Monitoring the energy consumption of the nodes is also important, so metrics related to energy usage patterns will be tracked.
The IKERLAN-developed monitoring platform can do this and support the instrumented codebase to gather application-specific performance indicators, traces and logs. All this valuable data is stored in time-series databases using Prometheus, which provides multiple exporters and libraries that facilitate collecting information from many third-party systems, such as NVIDIA boards featuring GPUs. Storing this information fuels two core functionalities of the EXTRACT platform.
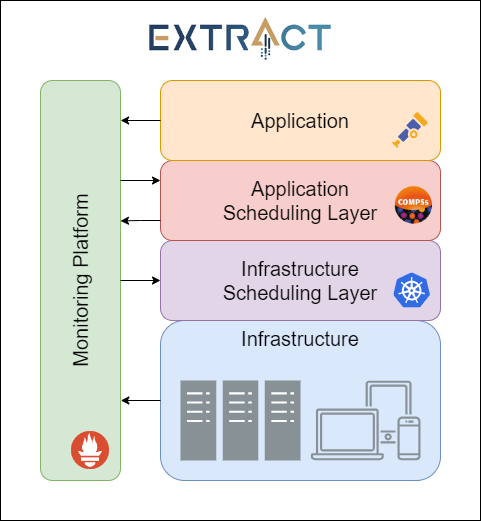
On the one hand, the data scraped from the nodes in the compute continuum is consumed by EXTRACT’s workflow deployment and scheduling mechanisms, composed of two layers: an Infrastructure layer and an Application layer. First, the Infrastructure layer allocates some computing resources among the available ones, and then the Application layer will orchestrate the application components and tasks within the resources provided.
Figure 1 Monitoring Architecture diagram
The monitoring platform provides up-to-date information of the underlying Edge to Cloud continuum for both layers, enabling informed and intelligent scheduling and deployment decisions. For that, Ikerlan has developed and integrated an API that enables retrieving metrics and serving them to COMPS seamlessly.
On the other hand, a graphical representation of this data is also provided to enable infrastructure administrators to monitor its state. These graphical charts rely on Graphana and allow detecting abnormal behavior of the infrastructure or the applications running on it in a fraction of the time it would require them to inspect the raw data.
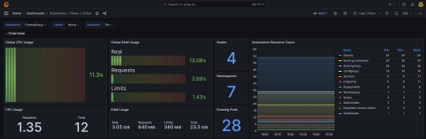
Figure 2 Monitoring Dashboard example
EXTRACT’s monitoring platform will keep evolving, including additional metrics such as communications network-state related ones. A key focus of future work will be monitoring and managing multicluster solutions through the proper definition of data-scraping and database federation approaches.